This article will be published on 10 July 2026.

What is a Gantt chart?
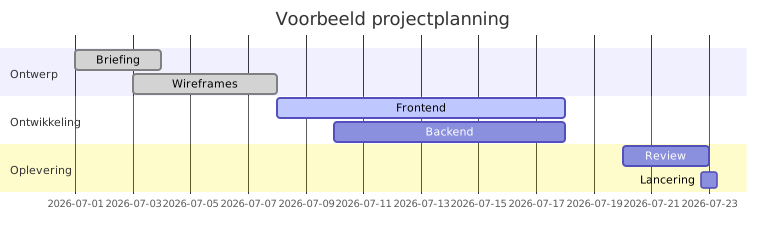
A Gantt chart is a bar chart that displays project tasks on a timeline. Each task is shown as a horizontal bar, with the length indicating the duration.
Why Gantt charts are useful
- Overview of all tasks and deadlines at a glance
- Insight into overlapping tasks and bottlenecks
- Easy communication of project progress to clients
- Early detection of delays
Gantt in PrikKlokPlus
PrikKlokPlus offers a built-in Gantt view per project. Tasks are automatically placed based on their start and end dates. The Gantt is linked to the Scrum board: a status change on the board is immediately reflected in the Gantt.